PivotTables

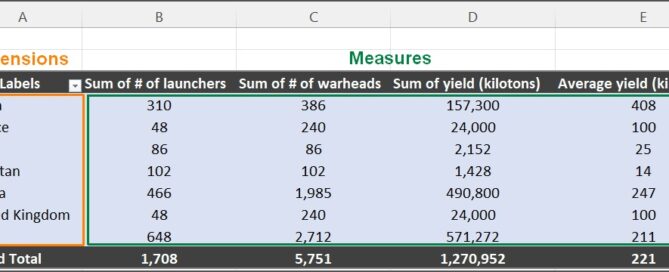
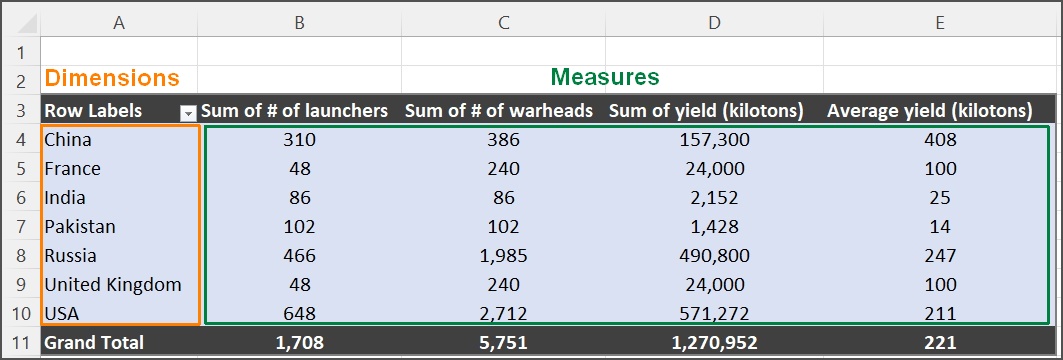
Dimensions and Measures in Excel Pivot Tables

Excel's pivot table is a tool that allows us to summarize and explore data held in one worksheet or Excel table, and display the results of the summarization in a second table. In this post we consider the basic workflow of creating pivot table reports by dragging fields to the appropriate sections of the PivotTable [...]

By |2022-08-09T18:01:16-06:00April 26th, 2022|Data Analysis, Excel, PivotTables|1 Comment

An Example of Using a PivotTable Instead of the SUBTOTAL Command

Recently we posted an article in which we looked at the example of the SUBTOTAL command (https://windsongtraining.ca/an-example-of-using-the-subtotal-command-in-excel/). We used this command to analyse the data set for the top 25 car sales by country in 2020 (https://www.factorywarrantylist.com/car-sales-by-country.html) (Figure 1). Figure 1 In this post we would like to use a Pivot Table for [...]

By |2022-01-26T17:43:37-07:00January 26th, 2022|Data Analysis, Excel, PivotTables|0 Comments
Go to Top