
In this article we are going to look at Excel’s Scenario Manager. It is one of the three sub-commands in the What-if-Analysis group on the Data Tab:
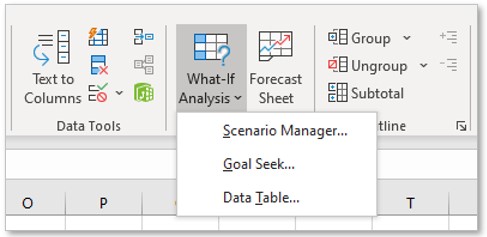
Fig. 1: The What-If-Analysis command and its three sub-commands
The Scenario manager, like Goal Seek and Data Table, allows us to see what would happen if we modified various parts of our data. In previous articles we have looked at a general overview of all three of the subcommands, (Jon’s article: What-if-analysis In Excel) and a more in-depth article on Goal Seek (Denise’s article: Excels Goal Seek – Part of What-If-Analysis). In this article we will look at the Scenario Manager in more detail with an example.
In the most basic terms, scenarios are simply different possibilities or events, and the Scenario Manager in Excel allows us to see possible outcomes when we change specific data values.
We are going to illustrate how to use this command with the following example: Suppose we are a fictitious business that sells candies and sweets. We sell these items, likely to other businesses, by the crate. Each crate only has one type of product. The sizes of the crates are all the same, but the weight for each crate will be different depending on the product type.
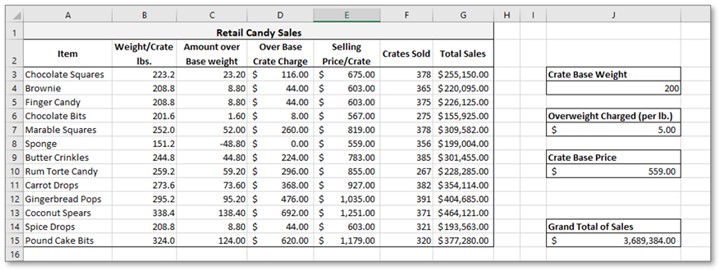
Fig. 2: Example data set.
Fig. 2 shows a spread sheet with a list of products (in locations A3 to A15) along with the weight of each crate (B3 to B15). The charging model for this business is to first price each crate with a minimum value $559 (stored in J10). Then anything over a base weight is multiplying it by the value in J7, $5.00 in this case. The cells E3 to E15 are simply the results of adding the Crate Base Price ($559) to the Over Base Crate Charge (cells D3 to D15). The Total Sales column, G3 to G15, are Crate Prices multiplied by the number of Crates Sold. That is, values in E3 to E15 are multiplied by the values in F3 to F15. Finally the Grand Total of sales is shown in cell J15.
We would like to see how changing the Crate Base Weight, the Crate Base Price, and the Overweight Charge will affect the Grand Total of Sales. To do this we are going to use Excel’s Scenario Manager.
As mentioned earlier, this command is located in the Data Tab in the What-If-Analysis group. Refer to Fig 3: using the drop down, you will be able to see the Scenario Manager sub command as the first option. Invoke the command by clicking on it:
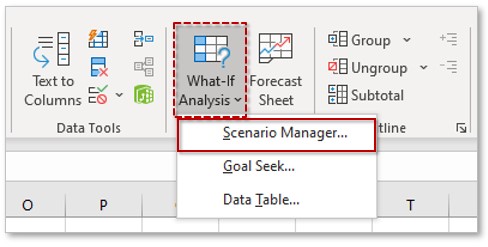
Fig. 3: The Scenario Manager
Once the command is selected the “Scenario Manager” dialog box opens. To get started just click on the “Add…” button. (see Fig 4):
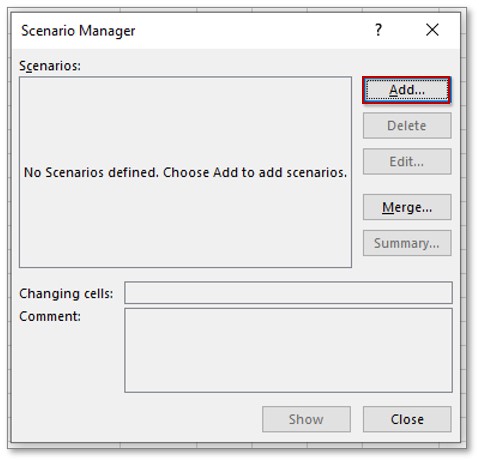
Fig. 4: The Scenario Manager dialog box
Another dialog box, the “Add Scenario”, will open:
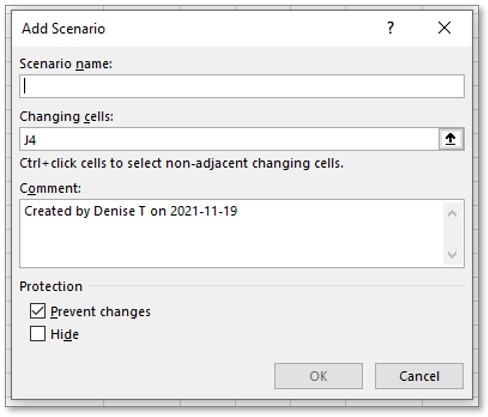
Fig. 5: The Add Scenario dialog box
We will start with the base case, so for the name we are just going to enter an obvious name: Base Case. For the numbers that we want to change, the “Changing cells” area, click on the locations in the spread sheet that reference the values we want to change (as the dialog box notes: use “CTRL click to select non-adjacent” cells). In this example J4, J7 and J10 are selected. Click on OK to get to the next step:
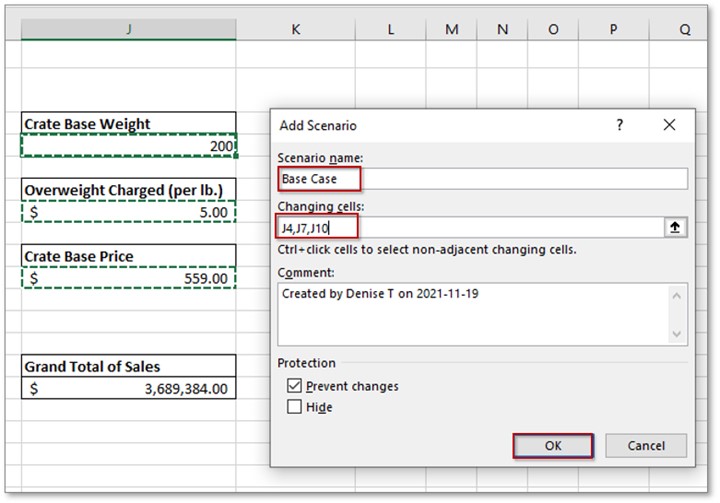
Fig. 6: The “base case” is entered into the Add Scenario dialog box, along with the location of the cells we want to change.
The next dialog box, the “Scenario Values”, Fig. 7, has the current values pre-entered for us, and since this is our base case, we will leave them as is. Just click on OK to continue.
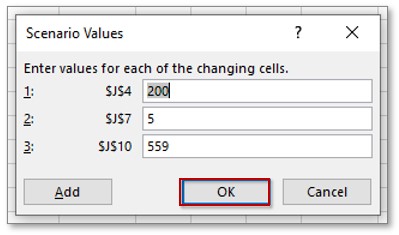
Fig. 7: The Scenario Values dialog box with current values pre-entered.
The main “Scenario Manager” dialog box will return with the first scenario, our Base Case, shown. To add another scenario, click on the “Add…” button. See Fig 8.
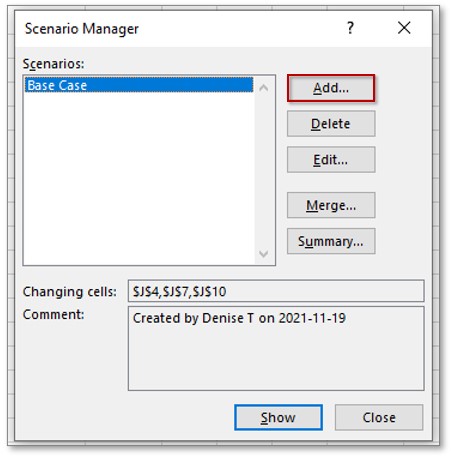
Fig. 8: The Scenario Manager dialog box with the first scenario entered.
In the resulting “Add Scenario” dialog box, we will add a new scenario. First, we need to give it a name: New Case. Note that the cells we want to change are already pre-loaded for us, so just click on OK:
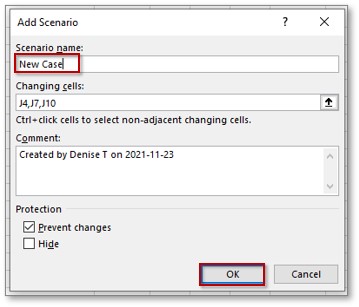
Fig. 9: The Add Scenario dialog box with our second scenario entered.
In the next dialog box, the “Scenario Values” Fig. 10, we type in the values that are needed to represent this new case. For our example we’ll explore the values 175 for the Crate Base Weight, 7 for the Overweight Charge, and 650 for the Create Base Price. Click on OK:
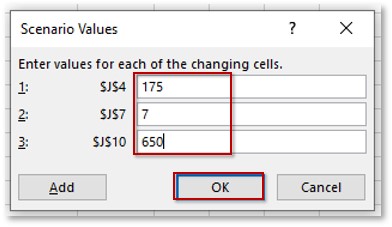
Fig. 10: The Scenario Values dialog box with the values for our new case.
We are back at the main “Scenario Manager” dialog box. See Fig. 11:
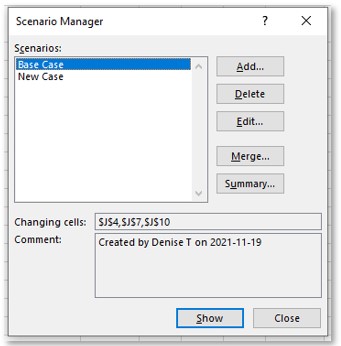
Fig. 11: The Scenario Manager dialog box showing the names of both the Base Case and the New Case.
To see the results of the “New Case” scenario; select New Case and then click on the “Show” button:
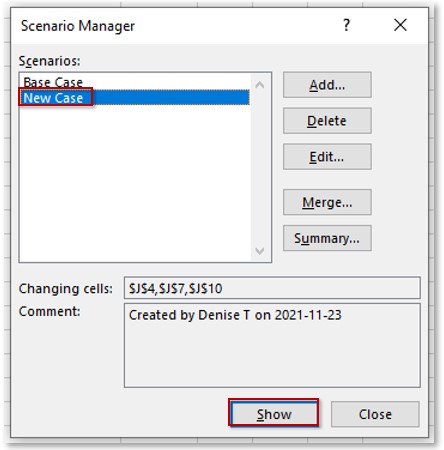
Fig. 12: The Scenario Manager with “New Case” name selected.
Figure 13 shows the result of clicking on the show button for the New Case:
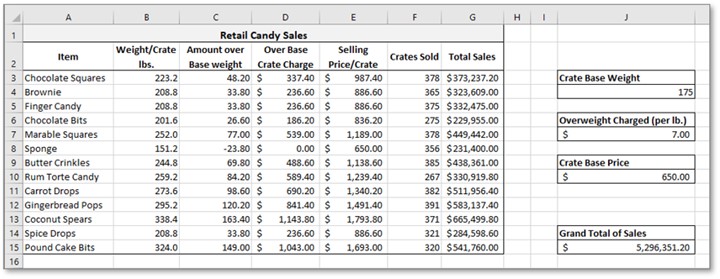
Fig. 13: The sample data set showing the changed values for the second scenario.
You can go back and forth between the two scenarios by simply clicking on the scenario name that you want, and then clicking on Show. For example, lets go back to the “Base Case”. Click on “Base Case” then on the Show button:
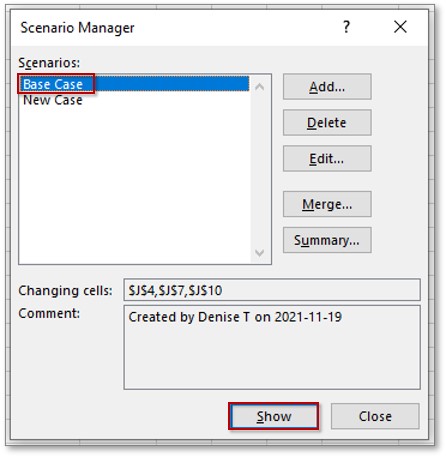
Fig. 14: Scenario Manager dialog box with “Base Case” selected
Here we see our original data:
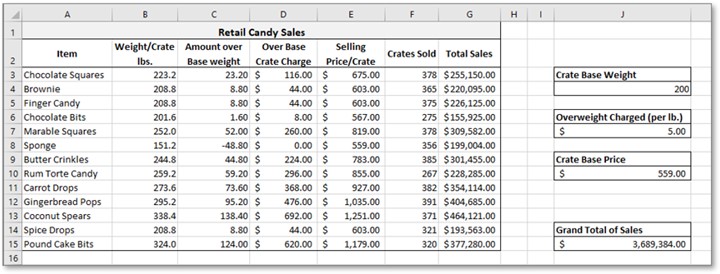
Fig. 15: Example data set showing the original data
Toggling between the two different scenarios is nice but a report would be even better. And we can get a report by using the “Summary” button. In the “Scenario Manager” dialog box, just click on “Summary”:
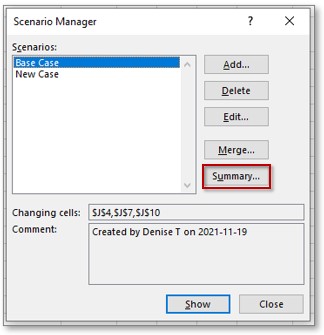
Fig. 16: The Scenario Manager dialog box with the Summary button indicated.
There is just one more step we have to do before we get the summary report, and in the next dialog box we need to indicate which cell we want to see as a result of the changes. For our example we want cell J15 the Grand Total of Sales, so either type in the location or click on the location. Then click on the OK button:
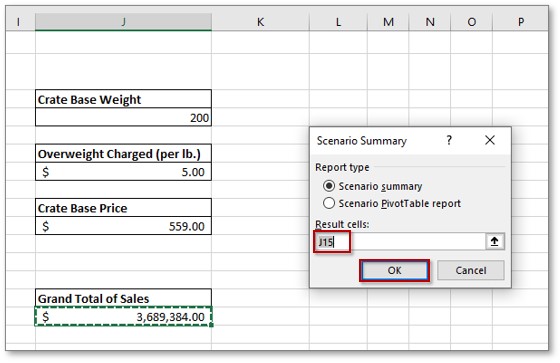
Fig. 17: The Scenario Summary dialog box
A report will be generated on a separate sheet:
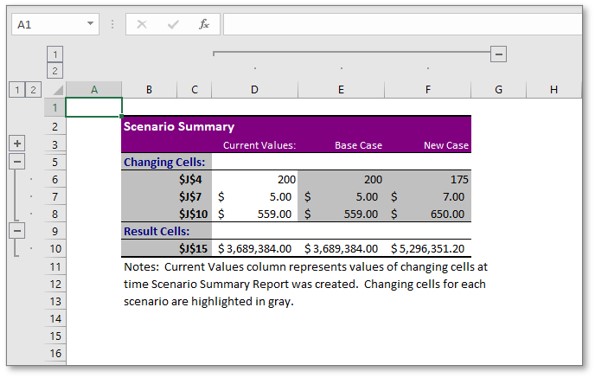
Fig. 18: The Scenario Summary report
The summary report lays out the differences between the two scenarios is a relatively straight forward way.
Under the Base Case we see 200, $5, and $599 as the values, under New Case we see 175, $7, and $650. Their locations are, in absolute referencing, $J$4, $J$7, and $J$10. We can also see the different values for the Grand Total for Sales, from the absolute reference $J$15, for the Base Case as $3,680,384 and for New Case as $5,296,351.
This is nice, but the summary report would be easier to read if we were to use names rather than locations.
There are a number of ways of defining names and most Excel users have their favorites. If you haven’t used cell names before, check out this companion article:
Here are the cell names that were defined for this example: Excel Basics: How-to Name a Cell or a Range of Cells
- Crate_Base_Price refers to cell J10
- Crate_Base_Weight refers to cell J4
- Grand_Total_of_Sales refers to cell J15
- Overweight_Charge refers to cell J7
Once, we have some names we can get a new summary report.
First open the “Scenario Manager” dialog box again. As before it is in the Data tab, in the What-If-Analysis group:
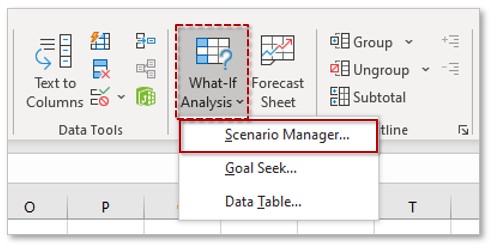
Fig. 19: The What-If-Analysis command with the Scenario Manager command indicated.
And click on the “Summary…” button:
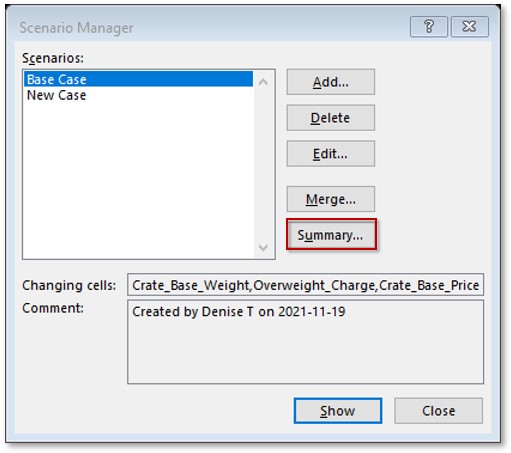
Fig. 20: Scenario Manager dialog box
In the next dialog box, the result cell(s) has been pre-loaded. It is the same value used from the previous step, so click on the “OK” button:
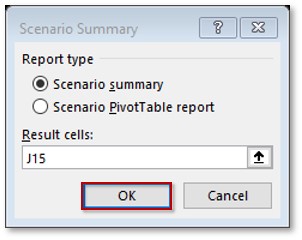
Fig. 21: The Scenario Summary dialog box
Here is the new Scenario Summary report:
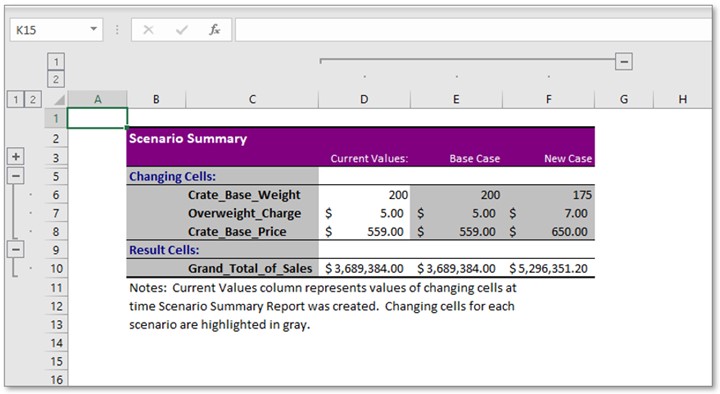
Fig. 22: Scenario Summary report showing the results with names rather than locations.
Using the names instead of locations allows for easier reading of the “Scenario Summary” report.
The Scenario Manager command is useful for experimentation and exploration, especially if you have a small number of cells to change. As a tool for exploring various scenarios, along with the handy scenario Summary for reporting purposes, it is well worth adding to your Excel tool kit.

Leave A Comment